Egmond consists of three villages:
Egmond aan Zee
,
Egmond aan den Hoef
and
Egmond-Binnen
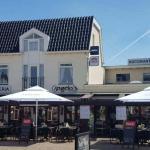
. Egmond aan Zee has a history as a fishing village, which in the early 19th century increasingly turned into a wonderful place to come and spend vacations.
It is still a pleasant family seaside resort where young and old feel at home, where it is lively, but the tranquility of nature is always close by. There are plenty of nice small-scale recreational facilities in the area.
Throughout the year, visitors from home and abroad come to our municipality for a day trip or an extended(er) stay. Consequently, the municipality has much to offer. Beach, forest,
dunes, polder area
and cozy villages are the biggest crowd pullers.
Our recreational facilities, museums, Visitors currently, guesthouses, campgrounds,
shopping facilities
and many others are consistent with this.
Attractive in all seasons
The Three Egmonds are attractive all year round, both for sporty outdoorsmen and for visitors who love peace, beauty, culture and history.
In Egmond-Binnen, the abbey attracts visitors from far and wide.
In the beautiful historic core of Egmond aan den Hoef lie the foundations of what was once the cleanest and largest castle in Holland.
White sandy beaches
Bergen County has an area of nearly 120 square kilometers and nearly 32,000 residents.
All the villages of the municipality have in common that they are near beautiful white sandy beaches, vast dune areas and here and there some forest.
Residents from neighboring communities enjoy taking advantage of the many recreational and cultural facilities the municipality has to offer.
Municipality of Bergen
Since 2001, the three Egmonden have not been an independent municipality, but fall under the name of Bergen.
The municipality consists of several villages and hamlets these are: Aagtdorp – Bergen – Bergen aan Zee – Bregtdorp – Camperduin – Catrijp – Egmond-Binnen – Egmond aan den Hoef – Egmond aan Zee – Groet – Hargen – Rinnegom – Schoorldam and Schoorl – Wimmenum.
The merger explicitly promised that each village would be allowed to keep its own identity, and this is also very important to the Egmonder.
Some technical data:
Housing in our villages For each village, you will see four pie charts. These show the percentage of homes by ownership, occupancy, type and construction period. Figure 4 is Egmond aan den Hoef (1517 homes), Figure 5 is Egmond aan Zee (2908 homes) and Figure 6 is Egmond Binnen (1131 homes).
Properties for sale are owned by the occupant(s) or used as second homes. Rental properties are not occupied by the property owner. Rental housing is divided into (1) housing owned by a housing corporation or other institution. And (2) rental housing owned by companies, individuals and investors.
Housing by occupancy:
A property is occupied if, according to the Basic Registration of Persons, at least 1 person was registered at the corresponding address. All other dwellings are considered unoccupied.
Houses by type:
A dwelling is multifamily when it forms a whole building together with other dwellings or (business) premises. This includes flats, gallery, porch, downstairs and upstairs houses, apartments and houses over commercial premises. All other homes are of the single-family type.
Houses by year of construction:
The year of construction is the year in which a property, in which a home is located, was originally completed. Construction year has two values here: (1) built in or after the year 2000 and (2) built before the year 2000.
Property Valuation Act

The average of the WOZ (Valuation of Immovable Property Act) values for the 3 Egmond villages. Data for the years 2013 through 2020.
When determining the average, only WOZ properties registered as residences (main residence or residence with practice space) are included.
The average house value in the Egmond aan Zee residential area increased by €29,140 from €263,108 in 2013 to €292,248 in 2020 (which is 11%).
The average home value in the town of Egmond aan den Hoef increased by €46,413 from €288,663 in 2013 to €335,076 in 2020 (which is 16%).
The average home value in the town of Egmond-Binnen increased by €30,945 from €276,375 in 2013 to €307,321 in 2020 (which is 11%).
The number of residents in the town of Egmond-Binnen decreased by 112 people from 2,703 in 2013 to 2,591 in 2021 (which is 4.15%).
The number of residents in the town of Egmond aan Zee decreased by 280 people from 4,801 in 2013 to 4,521 in 2021 (which is 6%).
The number of residents in the town of Egmond aan den Hoef decreased by 213 people from 3,826 in 2013 to 3,613 in 2021 (which is 6%).
Residence Egmond aan Zee
Egmond aan Zee has a rounded total area of 195 hectares, of which 195 is land and 0 is water (100 hectares is 1 km²).
Residence Egmond aan Zee has 4,156 unique addresses.
The average density of addresses is 1,172 addresses per km².
It has 2,240 households and a total of 2,908 housing units.
The residence has 2,281 cars and 460 business establishments.
Residence Egmond aan den Hoef
Egmond aan den Hoef has a rounded total area of 1,784 hectares, of which 1,768 is land and 17 water (100 hectares is 1 km²).
Residence Egmond aan den Hoef has 2,759 unique addresses.
The average density of addresses is 263 addresses per km².
It has 1,528 households and a total of 1,517 housing units.
The residence has 1,956 cars and 454 business establishments.
Residence Egmond-Binnen
Egmond-Binnen has a rounded total area of 1,217 hectares, of which 1,213 is land and 4 water (100 hectares is 1 km²).
Residence Egmond-Binnen has 1,705 unique addresses.
The average density of addresses is 374 addresses per km².
It has 1,117 households and a total of 1,131 housing units.
The residence has 1,368 cars and 290 business establishments.